
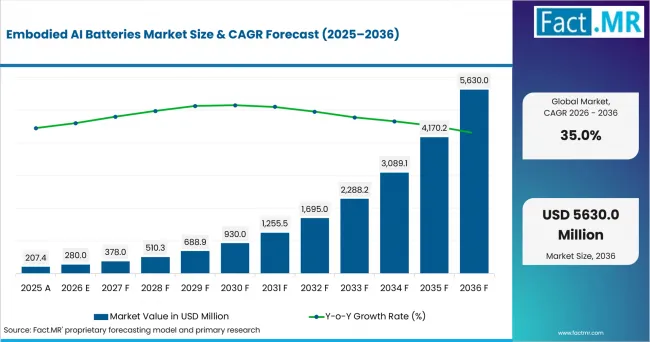
- The country comparison spans 13.7 percentage points and forms three practical growth bands across the forecast period.
- Germany remains 8.9 percentage points above the USA through automation depth and robot-pack qualification needs.
- The USA remains 2.0 percentage points above the UK as durable-goods orders sustain industrial automation spending.
- The UK remains 1.3 percentage points above Japan with advanced-manufacturing programs and factory digitalization support.
- Japan remains 1.5 percentage points above South Korea through robot order recovery and machinery-production depth.
- South Korea closes the displayed range as ICT exports and battery manufacturing scale support embodied AI supply chains.
Comparable CAGRs create different entry conditions due to robot density, manufacturing mix, battery supply and qualification routes. Full report coverage includes North America, Latin America, Western Europe, Eastern Europe, East Asia, South Asia & Pacific, Middle East & Africa.
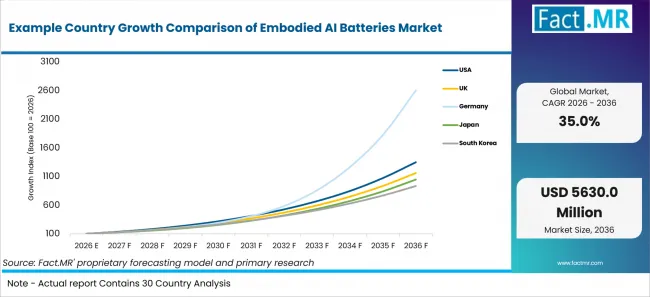
Example Country Growth Comparison Of Embodied Ai Batteries Market | Source: Fact.MR
What supports USA adoption?
29.8% CAGR, supported by durable-goods orders and factory robot use.
The USA has a large base of durable-goods customers relevant to factory automation investment. The U.S. Census Bureau reported in July 2026 that June durable-goods new orders reached USD 334.8 billion, with computers and electronic products up 3.1% to USD 31.1 billion.
What supports the United Kingdom’s growth?
27.8% CAGR, backed by smart-machine support and selective factory upgrades.
The UK market is shaped by selective factory upgrades in high-value production settings. The Office for National Statistics reported in August 2026 that UK manufacturing output grew 1.0% in the three months to June 2026 compared with the three months to March 2026. Output of computer, electronic and optical products increased 3.0% over the same period, providing a current production backdrop for electronics-intensive manufacturing.
What is supporting Germany’s adoption?
38.7% CAGR, supported by industrial robotics and manufacturing-order depth.
Germany benefits from a dense industrial buyer base that evaluates battery systems through production uptime and pack-safety evidence. Destatis reported in August 2026 that the real stock of manufacturing orders rose 0.8% month over month in June 2026. The increase provides current order-book context for Germany’s manufacturing and machinery sectors.
How does Japan perform?
26.5% CAGR, led by robot production and machinery-order recovery.
Japan has an established robot manufacturing base and a deep electronics supply chain for compact power systems. The Japan Robot Association reported in July 2026 that robot order value rose 40.0% year on year in April-June 2026, while production value increased 24.3%.
How is South Korea developing demand?
25.0% CAGR, shaped by ICT exports and battery manufacturing scale.
South Korea links battery production scale with electronics and precision manufacturing activity. MOTIR and MSIT reported in July 2026 that Korea’s ICT exports reached USD 253.9 billion in the first half of 2026, up 120.5% year on year. The figure indicates the scale and momentum of Korea’s ICT export sector.












Leave a Reply