

When customer and operational information is spread across customer relationship management (CRM) platforms, enterprise resource planning (ERP) systems, ticketing tools, spreadsheets and other applications, each system may hold valuable information, but the fragmentation of the data makes it difficult for teams to build a complete picture of business performance, identify emerging issues and make informed decisions.
Businesses often have plenty of information available, but extracting it from different applications and turning it into useful reports creates friction.
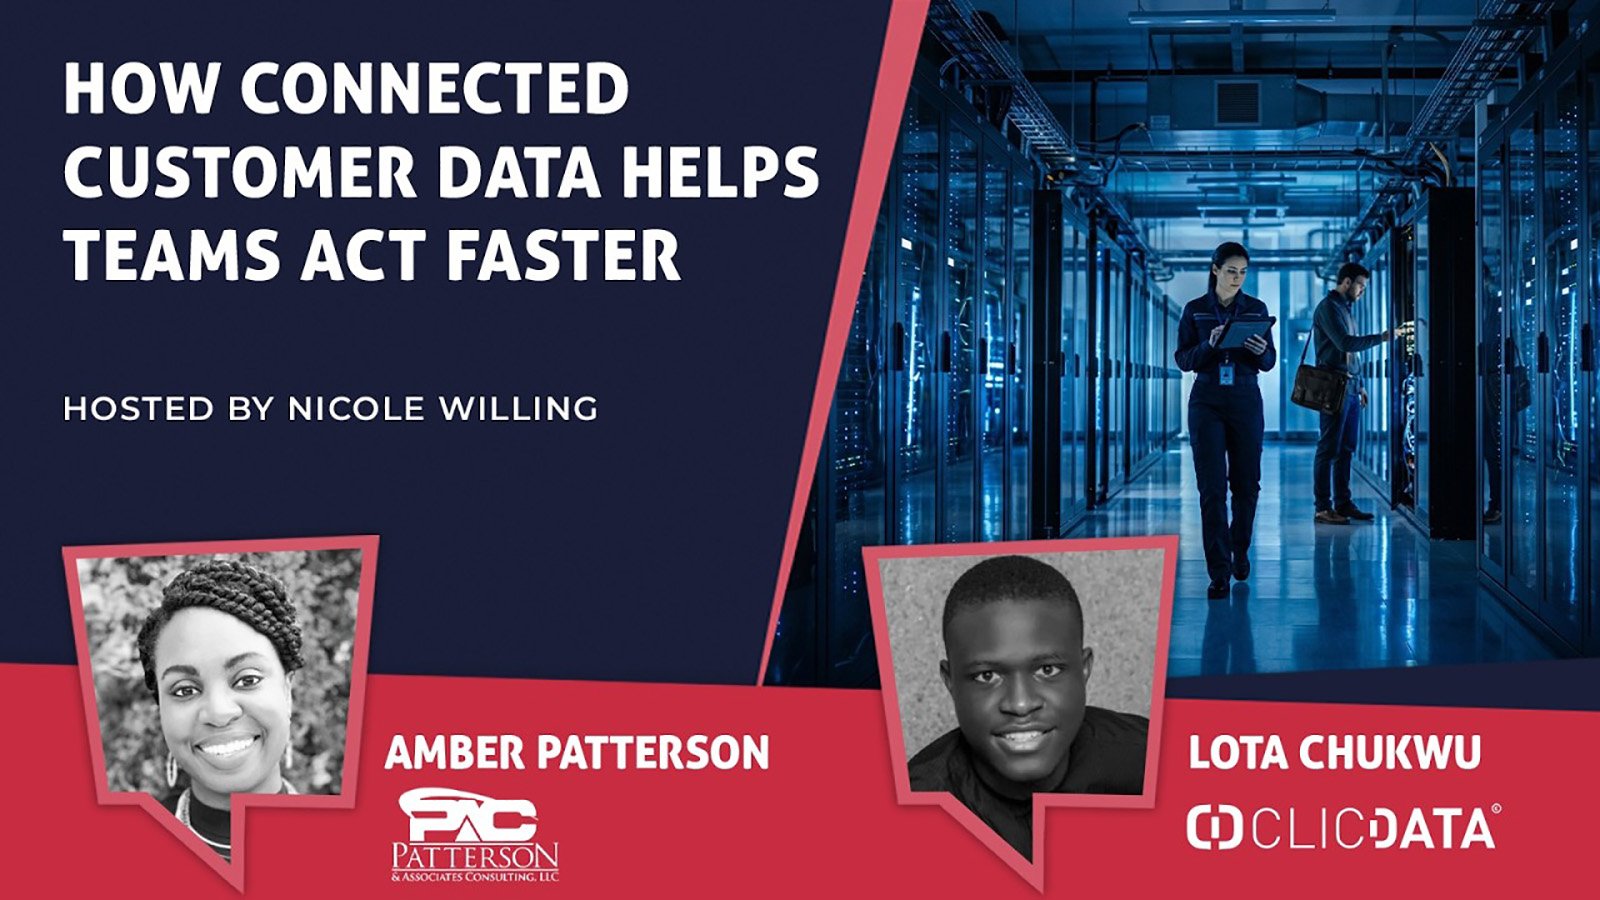
Patterson & Associates Consulting (PAC) works with data management platform ClicData to help its clients bring information together from disconnected business systems. Customers can automate the process and create accessible dashboards that give managers, executives and operational staff a clearer view of performance and benchmarks. The aim is to turn fragmented information into actionable data that supports faster, better-informed decisions. Amber Patterson, Chief Operating Officer (COO) and acting Chief Executive Officer (CEO), explained:
“We help our clients evaluate their data and really we try to put ourselves in their shoes and understand the challenges they have. They have all of the data, but the source of friction is that the reports have to be pulled from a CRM, an ERP, or a property or case management system.”
Those systems frequently operate independently, leaving employees responsible for bringing the information together.
ClicData sees similar issues among its customer base. “The major problems that customers approach us with… is fragmented information,” said Lota Chukwu, Sales Engineer at ClicData.
Businesses need a holistic view of their operations to make good decisions, but information is frequently distributed across CRM, project management and ticketing systems.
For Patterson, the consequences extend beyond the time spent compiling reports. Without accessible, consolidated information, teams can struggle to understand what is happening across the business.
“Because it wasn’t presented in a simplified metric of a bar chart or a graph, they couldn’t see certain trends, or where things were just falling through the cracks because there was just an information overload.”
Connecting Operational Data to Customer Outcomes
Patterson cited the example of a housing authority that uses a management system to track maintenance requests across residential buildings.
Residents submit work orders when something needs attention in their units. While the system contained valuable operational information, bringing that data into ClicData through an automated import gave the organization a clearer way to monitor performance.
Patterson explained that the reporting helped operational and IT teams identify where attention was needed, while giving managers better visibility into how quickly requests were being handled. “They could see where there were certain needs.” The organization can now track how long work orders take to complete and whether emergency requests are receiving an appropriate response.
The customer benefit is particularly important, “so that the residents get the services that they need in a timely way and that their units are safe. So that brings great value to their organization,” Patterson added.
The example indicates how connecting operational information can improve visibility into processes that directly affect service delivery and customer experiences.
AI Needs a Reliable Data Foundation
As businesses explore AI-powered analytics, fragmented information can limit what these tools can accomplish.













Leave a Reply