
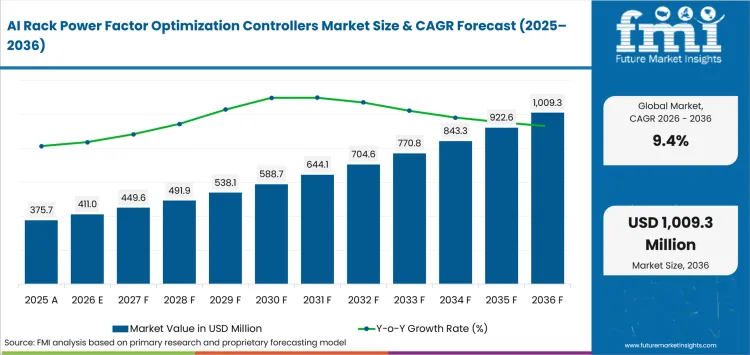
- Market Size (2026)
- USD 411.0 Mn
- Forecast (2036)
- USD 1009.3 Mn
- CAGR (2026 to 2036)
- 9.4%
How big is AI Rack Power Factor Optimization Controllers Market in 2026?
USD 411.0 million in 2026 and USD 1,009.3 million by 2036 at a 9.4% CAGR.
Demand for AI rack power factor optimization controllers is projected to expand at 9.4% CAGR between 2026 and 2036, increasing valuation from USD 411.0 million in 2026 to USD 1,009.3 million by 2036. Higher accelerator density exposes short load excursions that upstream data-center power infrastructure cannot follow without reserve capacity. The International Energy Agency estimated in April 2025 that data centers used about 415 TWh, or 1.5% of global electricity, in 2024. Operators reserve capacity for sustained loads, so poor rack-to-facility coordination becomes more costly as the data-center power base expands.
Country conditions determine whether controllers enter power design during connection planning or later through retrofit work, a distinction visible in Ireland. In December 2025, the Commission for Regulation of Utilities recorded data-center demand rising from 5% of national electricity in 2015 to 22% in 2024. Network limits place rack buffering and event records beside facility generation, storage and protection requirements during new-connection design.
Key Takeaways
- Higher accelerator density raises demand for rack-level buffering, fast event detection and coordinated power-quality control so brief excursions do not consume facility headroom.
- By solution function, transient buffering is estimated to hold 25.0% in 2026 owing to its ability to absorb brief rack-load excursions ahead of upstream response.
- In 2026, the 1-10 ms segment is expected to lead response time with 32.0% share because it balances fast intervention with practical system coordination.
- Within rack / pod load, 250-500 kW is forecast to represent 34.0% in 2026 driven by density that already affects bus capacity and protection settings.
- Interoperability testing can extend qualification if rack power shelves, UPS systems and protection logic do not reproduce the same event sequence reliably.
- Some of the key players in this market include Eaton, Janitza, Dranetz, and ABB.
Analyst Perspective
“Qualification records carry more value than nominal response-time claims for AI rack controllers. Data-center engineers should compare event resolution, buffering authority and protection coordination against service evidence that can reproduce a rack event during commissioning.”
– , Principal Consultant, Future Market Insights
How is the AI rack power factor optimization controllers market segmented?
The AI rack power factor optimization controllers market is segmented by solution function, response time, rack / pod load, facility type, sales channel and region.
Solution function covers transient buffering, harmonic mitigation, voltage ride-through, power-factor correction and event measurement / recording. Response time spans 1-10 ms, sub-millisecond, 11-100 ms and above 100 ms. Rack / pod load covers 250-500 kW, below 250 kW, 501-750 kW and above 750 kW. Facility type includes hyperscale AI, colocation, enterprise data centers and HPC / research. Sales channels cover OEM direct, electrical integrator / EPC, power-quality specialist and distributor / service partner.
Why does transient buffering lead demand within the solution function category?
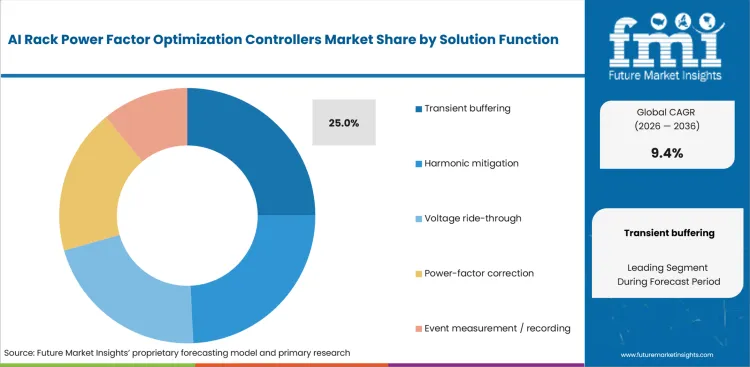
Transient buffering covers the interval between a rapid GPU load change and slower upstream conversion or generation. Eaton included integrated energy storage in its October 2025 800 VDC reference architecture for high-density AI power delivery. Stored energy near the rack gives upstream equipment more time to respond to brief load excursions.
- Based on solution function, transient buffering is projected to account for 25.0% in 2026 due to its direct role in limiting abrupt rack-load excursions.
- Engineering teams specify buffering earlier if stored energy and event records can be validated with the power shelf and upstream UPS.
Why does 1-10 ms lead demand within the response time category?
The 1-10 ms band acts inside short electrical events and leaves coordination time for protection and conversion hardware. Eaton announced SSO-detection firmware in September 2025 that identifies large AI power fluctuations. Fast recognition gives power monitoring systems time to trigger local intervention without passing the disturbance upstream.
- The 1-10 ms segment is set to lead response time with 32.0% share in 2026 due to its fit between fast intervention and practical coordination.
- Unclear event chronology makes fast controllers harder to commission safely, so acceptance depends on synchronized sensing and time-stamped records.
How does 250-500 kW shape demand within the rack / pod load category?
The 250-500 kW band bridges high-density racks and early megawatt-scale AI electrical designs. Short excursions at this level can affect bus capacity without requiring a full megawatt rack. Vertiv said in May 2025 that AI rack requirements were extending beyond 300 kW as it aligned its 800 VDC roadmap with future compute platforms.
- By rack / pod load, 250-500 kW is forecast to represent 34.0% in 2026 driven by load behavior that already affects facility design.
- One event-data model reduces commissioning work if it can extend from rack testing to pod-level coordination.
What supports hyperscale AI within the facility type category?
Hyperscale AI sites aggregate enough accelerator load for correlated power changes to influence whole power blocks. ABB and Applied Digital announced a 400 MW greenfield North Dakota campus partnership in June 2025 using a medium-voltage power architecture. Repeated halls let one qualified control and protection design carry into later build phases.
- Hyperscale AI is likely to capture 45.0% share in 2026 attributable to concentrated accelerator loads and repeatable electrical designs in large build programs.
- Hyperscale developers spread qualification work over several halls, but controller behavior must stay consistent as electrical power blocks repeat.
What drives OEM direct within the sales channel category?
OEM direct sales fit projects that qualify firmware, power shelves and event telemetry as one design package. Eaton’s July 2025 collaboration with NVIDIA covered reference architectures and 800 V HVDC infrastructure for 1 MW racks and beyond. The collaboration brings controller selection into rack design ahead of site-level commissioning.
- OEM direct is projected to hold 37.0% share in 2026 owing to earlier control integration and fewer unresolved deployment interfaces.
- Electrical integrators retain a site-specific role, but direct design-in has an advantage for rack configurations repeated at scale.
What are the drivers, restraints and opportunities in the AI Rack Power Factor Optimization Controllers Market?
Faster AI load changes increase demand for local control, qualification complexity slows acceptance, and integrated project services can move controller specification earlier in the power design.
- Driver: Higher synchronized accelerator loads increase the value of buffering and event evidence as operators plan upstream electrical capacity.
- Restraint: Interconnection and protection requirements lengthen qualification if rack response interacts with UPS settings, facility generation or utility service rules.
- Opportunity: Integrated measurement and configuration services paired with commissioning can shorten handoffs between controller selection and site acceptance.
AI power growth raises the cost of uncontrolled load swings
AI electricity demand is rising faster than much of the power infrastructure serving high-density data centers. In April 2026, the IEA said global data-center electricity use increased 17% in 2025 and AI-focused facilities grew even faster. Larger synchronized rack loads increase the need for buffering, power-factor response and event visibility as brief excursions consume reserve margin allocated to sustained demand.
Interconnection and protection rules lengthen controller qualification
Qualification slows once rack controls must coordinate with site protection, co-located generation or utility service rules. In December 2025, FERC directed PJM to establish clearer service rules for AI-driven data centers and other large co-located loads. Commissioning teams must therefore prove local response does not conflict with data-center UPS behavior or protection settings required by the service agreement during final acceptance.
Integrated project services bring control decisions into early design
Integrated offers can shift controller selection earlier by packaging measurement, configuration and commissioning with response hardware. Janitza opened its Appenweier site and launched Project Solutions in July 2025 for integrated energy-management and power-quality projects. A broader data-center power management model lets Janitza address metering, control logic and acceptance testing early enough to influence OEM or EPC specifications.
Which country CAGRs are profiled in the AI Rack Power Factor Optimization Controllers Market?
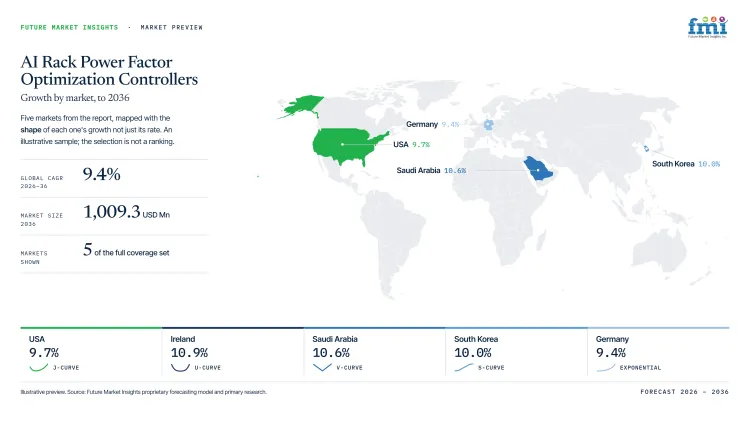
| Country | CAGR |
|---|---|
| Ireland | 10.9% |
| Saudi Arabia | 10.6% |
| UAE | 10.3% |
| South Korea | 10.0% |
| USA | 9.7% |
| Germany | 9.4% |
How do country-level CAGRs compare in the AI Rack Power Factor Optimization Controllers Market?
A 1.5-point spread separates Ireland at 10.9% from Germany at 9.4%, but the narrow range masks different project conditions. Ireland and Saudi Arabia form the upper group as power constraints pull controls into early design. UAE and South Korea follow through newer campus programs. USA and Germany carry more retrofit or compliance work than the upper group.
- Ireland gives flexible-load behavior greater weight during large-campus network review.
- Saudi procurement favors electrical packages that arrive with local service coverage for large infrastructure programs.
- UAE hyperscale projects concentrate controller qualification within a small number of very large campus programs.
- South Korea has a dense electronics engineering base that shortens coordination between rack design and power-quality teams.
- USA utility fragmentation makes controller qualification more site-specific.
- German projects place a premium on interoperable controls that fit formal electrical design reviews without late interface changes.
Qualification therefore diverges despite similar CAGRs.
The full report provides country-level CAGR analysis across North America, Latin America, Western Europe, Eastern Europe, East Asia, South Asia and Pacific, and the Middle East and Africa.
Country-wise Analysis
- USA operators usually add rack-level controls to installed hyperscale power trains, so new buffering must coexist with existing UPS units and protection settings. The USA is forecast to grow at 9.7% CAGR over the assessment period, tied to a large retrofit base and rising power demand. Lawrence Berkeley National Laboratory estimated in June 2026 that data centers could reach 11.8% of USA electricity use by 2030. Existing facilities give integrators repeat deployment opportunities, but legacy interfaces lengthen qualification unless event records prove stable behavior without replacing surrounding electrical equipment. Retrofit programs therefore favor controllers whose time-stamped evidence fits existing commissioning and protection procedures.
- Irish data-center projects treat electricity availability as a design constraint as developers finalize generation, storage and connection arrangements. Central Statistics Office data released in July 2026 show data centers consumed 23% of metered electricity during 2025. Grid constraints strengthen the case for buffering and event telemetry, but orders depend on proving the wider facility can meet connection conditions without unmanaged demand. Ireland is projected to expand at 10.9% CAGR through 2036, owing to connection pressure that pulls power-control decisions into early site planning. Controller manufacturers involved during early power planning can position event evidence beside capacity, storage and network commitments.
- German data-center engineers place energy efficiency, metering and protection documentation inside the same approval workflow, so late controller changes are expensive. In June 2026, the federal government extended the transition for new data-center PUE requirements from two years to four and shifted full renewable-electricity accounting to January 2030. Germany is forecast to post 9.4% CAGR during the forecast period, reflecting a mature engineering base with more implementation time. Controller interfaces must fit existing meters and protection settings for facility approval to proceed. Controller manufacturers gain acceptance by supplying configuration records that facility teams can place directly into compliance and commissioning files.
- South Korean AI infrastructure planning now pairs GPU procurement with electricity supply and site allocation. Demand for AI rack power factor optimization controllers is predicted to advance at 10.0% CAGR through 2036, aided by coordinated public investment in computing capacity. In February 2025, the Ministry of Science and ICT announced a plan to secure 18,000 high-performance GPUs by the first half of 2026 and strengthen electricity-supply and site support. Power-system review therefore enters compute projects earlier and gives rack OEMs a design-in route. Location approvals can delay projects unless local engineers validate controller response early enough to influence the final electrical design.
- Saudi data-center construction is concentrated in greenfield programs where EPC contractors can specify rack power trains and electrical rooms during early equipment specification. The Ministry of Communications and Information Technology stated in April 2026 that capacity exceeded 440 MW in 2025 from 68 MW in 2021, with more than 60 data centers operating. Saudi Arabia is expected to register 10.6% CAGR over the forecast period, given a pipeline that favors early design-in and repeatable electrical packages. Rapid buildout stretches specialist service coverage, so controller manufacturers need documented interoperability and commissioning support from factory acceptance to site energization on new campuses.
- UAE AI campuses use phased power blocks that let operators standardize electrical architecture during the first build and reuse approved controls later. Abu Dhabi Media Office announced Stargate UAE in May 2025 as a 1 GW compute cluster inside a planned 5 GW campus. The first 200 MW phase is expected during 2026 and gives controller manufacturers a clear point to qualify common telemetry and settings ahead of subsequent blocks entering service. The UAE is projected to record 10.3% CAGR during the assessment period, propelled by greenfield scale. Shared upstream infrastructure raises correction costs if protection or response settings differ between blocks.
Who are the notable companies in the AI Rack Power Factor Optimization Controllers Market?
Eaton, Janitza, Dranetz, and ABB are the notable companies profiled in this market.
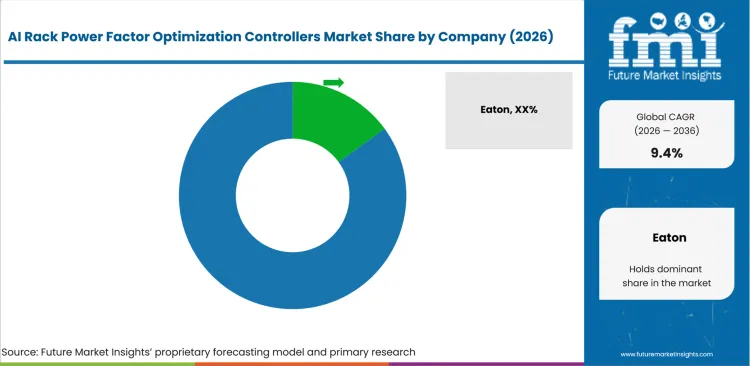
Eaton and ABB enter controller decisions through broader distribution and protection platforms. Janitza and Dranetz compete through power-quality measurement and event records used during qualification. Eaton and ABB can influence rack-to-grid electrical design earlier in the project. Entry therefore depends on proof quality and protocol fit as much as corporate scale.
- Eaton and ABB cover architecture-level power distribution, protection and control integration for data-center electrical design.
- Janitza focuses on continuous power-quality measurement and software integration that turns event data into operating records for commissioning.
- Dranetz focuses on waveform diagnostics and continuous monitoring backed by service support for commissioning and post-event investigation.
Competitive Benchmarking: AI Rack Power Factor Optimization Controllers Market
| Company | Architecture Integration | Digital / Measurement Depth | AI Data-Center Fit | Geographic Reach |
|---|---|---|---|---|
| Eaton | High | High | High | Global |
| Janitza | Medium | High | High | Global, serving more than 90 countries |
| Dranetz | Medium | High | Medium | Americas with wider GMC Instruments coverage |
| ABB | High | High | High | Global |
Scoring basis: High architecture integration requires documented links between multiple electrical layers used in data-center design or commissioning. Medium requires integration with one facility electrical or monitoring layer, and Low denotes stand-alone analysis. High digital / measurement depth requires event-level or real-time diagnostic evidence plus software or digital controls. Medium requires continuous monitoring with narrower event evidence, and Low denotes basic metering. High AI data-center fit requires a dated AI program with direct electrical relevance to rack deployment. Medium requires data-center-specific power-quality use, and Low covers broader critical-power applications without an AI-specific program.
Key Developments in the AI Rack Power Factor Optimization Controllers Market
- In December 2025, Eaton announced a 350,000-square-foot Virginia manufacturing campus for data-center power distribution equipment, with production scheduled for 2027.
- In October 2025, ABB launched an AI-ready MNS low-voltage switchgear configuration integrating SACE Emax 3 sensing and power-quality analysis for higher-density data centers.
- In May 2025, Janitza released GridVis 9.2 with virtual measurement points and centralized device-management tools for distributed energy and power-quality monitoring.
Key Players in the AI Rack Power Factor Optimization Controllers Market
Integrated AI Data-Center Power Architecture
Power-Quality Measurement and Event Analytics
Protection and Digital Power Distribution
AI Rack Power Factor Optimization Controllers Market – Report Scope
| Coverage field | Report scope |
|---|---|
| Market breakdown | By solution function, response time, rack / pod load, facility type, sales channel and region. |
| Quantitative Units | USD million. |
| Market Definition | Controllers and controller-connected power-quality functions used to detect, buffer, correct or document short-duration electrical behavior at AI rack and pod level. |
| Regions Covered | North America, Latin America, Western Europe, Eastern Europe, East Asia, South Asia and Pacific, and Middle East and Africa. |
| Countries Covered | USA, Ireland, Germany, South Korea, Saudi Arabia, UAE, and 30+ countries included in the full report. |
| Key Companies Profiled | Eaton, Janitza, Dranetz, ABB. |
| Forecast Period | 2026 to 2036. |
| Approach | Primary and secondary research with market triangulation. |
AI Rack Power Factor Optimization Controllers Market – Research Methodology
| Method | Approach |
|---|---|
| Primary Research | FMI analysts gathered input from manufacturers, service providers, technology developers, distributors, end users, procurement teams, and subject-matter experts. Interviews examined purchasing decisions, product or service evaluation, adoption barriers, approval requirements, pricing considerations, and expectations for technical or commercial support. Respondents were also asked what evidence is required before a trial, pilot, or initial order develops into regular purchasing. |
| Desk Research | Desk research covered government statistics, regulatory publications, trade data, industry associations, technical literature, standards, company filings, product information, and official corporate announcements. Sources were reviewed for relevance, publication date, geographic coverage, and consistency with the defined market scope. Claims relating to performance, applications, approvals, capacity, investment, and commercial activity were retained only when supported by credible public evidence. |
| Market Sizing and Forecasting | The market model combined the baseline value with historical performance, segment structure, pricing and volume indicators, adoption levels, company participation, and country-level demand conditions. Forecast assumptions considered economic activity, investment trends, regulatory developments, technology adoption, purchasing cycles, supply availability, and barriers to wider market use. Segment and regional estimates were reconciled before the final market total was calculated. |
| Data Validation | Estimates were checked against multiple independent indicators, including public data, company activity, trade patterns, industry developments, and findings from primary interviews. Validation also tested whether products, services, applications, and company revenues fell within the defined market boundaries. Adjacent categories, unsupported claims, overlapping revenues, and activities without direct market relevance were excluded to reduce double counting and maintain consistency across segments and countries. |
AI Rack Power Factor Optimization Controllers Market by Segments
AI Rack Power Factor Optimization Controllers Market segmented by Solution Function:
- Transient buffering
- Harmonic mitigation
- Voltage ride-through
- Power-factor correction
- Event measurement / recording
AI Rack Power Factor Optimization Controllers Market segmented by Response Time:
- 1-10 ms
- Sub-millisecond
- 11-100 ms
- Above 100 ms
AI Rack Power Factor Optimization Controllers Market segmented by Rack / Pod Load:
- 250-500 kW
- Below 250 kW
- 501-750 kW
- Above 750 kW
AI Rack Power Factor Optimization Controllers Market segmented by Facility Type:
- Hyperscale AI
- Colocation
- Enterprise data centers
- HPC / research
AI Rack Power Factor Optimization Controllers Market segmented by Sales Channel:
- OEM direct
- Electrical integrator / EPC
- Power-quality specialist
- Distributor / service partner
AI Rack Power Factor Optimization Controllers Market by Region:
- North America
- Latin America
- Brazil
- Mexico
- Argentina
- Chile
- Western Europe
- Germany
- Ireland
- France
- United Kingdom
- Italy
- Spain
- Benelux
- Nordics
- Eastern Europe
- Poland
- Czech Republic
- Romania
- Hungary
- East Asia
- South Asia and Pacific
- India
- ASEAN
- Australia and New Zealand
- Middle East and Africa
- GCC Countries
- South Africa
- Türkiye
- Israel
Research Sources and Bibliography
- International Energy Agency. (2025, April 10). Energy and AI.
- Commission for Regulation of Utilities. (2025, December 12). The CRU Publishes its Decision on New Electricity Connection Policy for Data Centres.
- Eaton. (2025, October 13). Eaton unveils next-generation architecture to advance 800 VDC power infrastructure for AI factories.
- Eaton. (2025, September 9). Eaton delivers edge-based innovation to help mitigate the impact of AI power bursting on both data centers and the grid.
- Vertiv. (2025, May 21). Vertiv Accelerates AI Infrastructure Evolution in Alignment with NVIDIA 800 VDC Power Architecture Announcement.
- ABB. (2025, June 11). ABB and Applied Digital accelerate AI-ready data centers.
- Eaton. (2025, July 15). Eaton accelerates the transformation of data center infrastructure in the AI era with NVIDIA.
- International Energy Agency. (2026, April 16). Data centre electricity use surged in 2025, even with tightening bottlenecks driving a scramble for solutions.
- Federal Energy Regulatory Commission. (2025, December 18). FACT SHEET | FERC Directs Nation’s Largest Grid Operator to Create New Rules to Embrace Innovation and Protect Consumers.
- Janitza. (2025, July 22). Janitza Launches Project Solutions and Opens New Site in Appenweier.
- Lawrence Berkeley National Laboratory. (2026, June). United States Data Center Energy Usage Report: 2025 Update.
- Central Statistics Office. (2026, July 7). Data Centers Metered Electricity Consumption 2025.
- Federal Ministry for Economic Affairs and Energy. (2026, June 24). Vereinfachungen umgesetzt und Bürokratie reduziert – Bundeskabinett beschließt Energieeffizienzgesetz.
- Ministry of Science and ICT, Republic of Korea. (2025, February 20). Korea to Expand AI Computing Infrastructure to Strengthen National AI Capabilities and Achieve Global Leadership.
- Ministry of Communications and Information Technology, Saudi Arabia. (2026, April 28). Saudi Arabia Strengthens Its Global Position in Artificial Intelligence Through Data Center Growth and Accelerated Smart Manufacturing.
- Abu Dhabi Media Office. (2025, May 22). Global Tech Alliance Launches Stargate UAE.
- Eaton. (2025, September 15). Eaton accelerates transformation of building and data center infrastructure with Autodesk to deliver AI-powered digital energy twin and software tools.
- Eaton. (2026, March 16). Eaton collaborates with NVIDIA to unveil the Eaton Beam Rubin DSX platform to address the nearly $7 trillion data center buildout market from grid to chip.
- Janitza. (2025, July 3). AI Data Centers: Power Quality More Critical Than Ever.
- Janitza. (2025, July 18). Successful TÜV Süd Audit and Strong Result for GridVis®.
- Janitza. (2026, June 19). Janitza Marks 40 Years as Demand Grows for Power Quality and Grid Visibility.
- Dranetz. (2025, May 15). Stop the Noise: How to Fine-Tune Waveshape Triggering for Distorted Loads.
- Dranetz. (2025, June 9). Power Quality Standards: What You Need to Know.
- Dranetz. (2025, May 9). When a Data Center Goes Dark: What Downtime Really Costs.
- Dranetz. (n.d.). GMC Instruments Americas. Retrieved September 3, 2026.
- ABB. (2025, September 15). ABB Unveils SACE® Emax 3 in the US to Solve What’s Next in Power Distribution.
- Eaton. (2025, December 10). Eaton invests $50M+ in new Virginia facility to advance grid-to-chip AI data center solutions.
- ABB. (2025, October 8). ABB launches next-generation power solution for AI-ready data centers.
- Janitza. (2025, May 8). GridVis® 9.2: New Software Update.
- Eaton. (2026, April 8). Eaton expands operations in Nebraska with new manufacturing facility to meet increasing switchgear demand driven by AI data center boom.
- ABB. (2026, March 26). ABB and VoltaGrid extend collaboration on data center power infrastructure.
- Eaton. (2026, January 28). Eaton expands modular data center offering for rapid deployment of AI factories from grid to chip.
- Janitza. (2025, July 24). Janitza acquires majority stake in Digimondo – Software expertise for complete solutions strengthened.
- ABB. (2025, November 10). ABB and VoltaGrid partner to deliver stable data center power to support AI growth.
- Dranetz. (2025, October 9). A Calibration Partner You Can Count On.
- ABB. (2026, April 3). ABB Unveils World-First Cybersecure Air Circuit Breaker to Protect Vietnam’s Critical Infrastructure.
- Eaton. (2026, August 17). Trane Technologies and Eaton collaborate on industry-first reference design.
- Janitza. (2026, June 24). Janitza Celebrates 40 Years of Growth and Showcases New Future Factory.
- Dranetz. (2025, July 11). GMC Instruments Americas expands with new headquarters – strengthening the Dranetz legacy.
- ABB. (2026, July 2). ABB and Podium partner to bring next-generation technology to early-stage data center development.
This bibliography is provided for reader reference and is not exhaustive. The full report contains the complete reference list and detailed citations.
This Report Answers
- What are the 2026 and 2036 values?
- Which rack-power conditions increase controller demand?
- Why does transient buffering lead solution function?
- Why does 1-10 ms lead response time?
- Why does 250-500 kW lead rack / pod load?
- How do the six profiled country CAGRs compare?
- How do Eaton, Janitza, Dranetz and ABB differ?
- Which qualification conditions slow controller adoption?
Frequently Asked Questions
How big is the AI rack power factor optimization controllers market in 2026?
The AI rack power factor optimization controllers market is valued at USD 411.0 million in 2026 and is projected to reach USD 1,009.3 million by 2036. Higher rack density raises demand for local buffering and event control.
What is the CAGR of the AI rack power factor optimization controllers market from 2026 to 2036?
The AI rack power factor optimization controllers market is projected to grow at a CAGR of 9.4% between 2026 and 2036. Denser racks and earlier electrical specification place controller decisions inside power-system design.
Which solution function leads the AI rack power factor optimization controllers market?
The transient buffering segment is expected to hold 25.0% of the AI rack power factor optimization controllers market in 2026, driven by the need to absorb brief rack-load excursions. It gives upstream conversion and UPS systems more time to respond.
Which facility type holds the largest share of the AI rack power factor optimization controllers market?
The hyperscale AI segment is expected to hold 45.0% of the AI rack power factor optimization controllers market in 2026, attributable to concentrated accelerator loads and repeated electrical designs. Large campus programs can reuse qualified controller settings between data halls.
Which countries are projected to record the highest growth in the AI rack power factor optimization controllers market?
Ireland is projected to grow at 10.9% CAGR, followed by Saudi Arabia at 10.6% and the UAE at 10.3% through 2036. Grid constraints and greenfield campus programs bring controller decisions into different stages of project design.
Which companies are active in the AI rack power factor optimization controllers market?
Key companies operating in the market include Eaton, Janitza, Dranetz, and ABB. Eaton and ABB span power architecture, whereas Janitza and Dranetz focus on measurement and event evidence used during qualification.
Preview the report firsthand – request a free sample
Get the brochure for pricing and purchase details.










Leave a Reply