

Advance Auto Parts: Maintaining Steady Top-Line Revenue Results
Advance Auto Parts (AAP -2.04%) primarily earns its living by operating thousands of retail locations that supply automotive replacement parts, batteries, specialty tools, accessories, and essential maintenance fluids to professional mechanics and do-it-yourself consumers throughout the United States, Canada, Puerto Rico, and the U.S. Virgin Islands.
It recently advanced an operational initiative to consolidate its supply chain and distribution network into a smaller number of large facilities, and it simultaneously planned the opening of 30 new physical store locations across several states.
Dick’s Sporting Goods: A Broad Upward Revenue Trajectory
Dick’s Sporting Goods (DKS -1.74%) generates the vast majority of its income by operating an extensive omni-channel retail network that provides athletic apparel, specialty footwear, fitness equipment, and outdoor recreational gear to sports enthusiasts, casual consumers, and athletes across the country through its physical stores and digital mobile platforms.
While facing several securities class action lawsuits regarding past executive statements about its Foot Locker inventory integration, it actively recruited seasonal holiday teammates and successfully opened a large experiential retail facility featuring interactive golf simulators.
Why Revenue Matters for Investors
Revenue here refers to the data provider’s standardized income statement revenue line item, which shows the total amount of money a business collects before operating expenses are deducted.

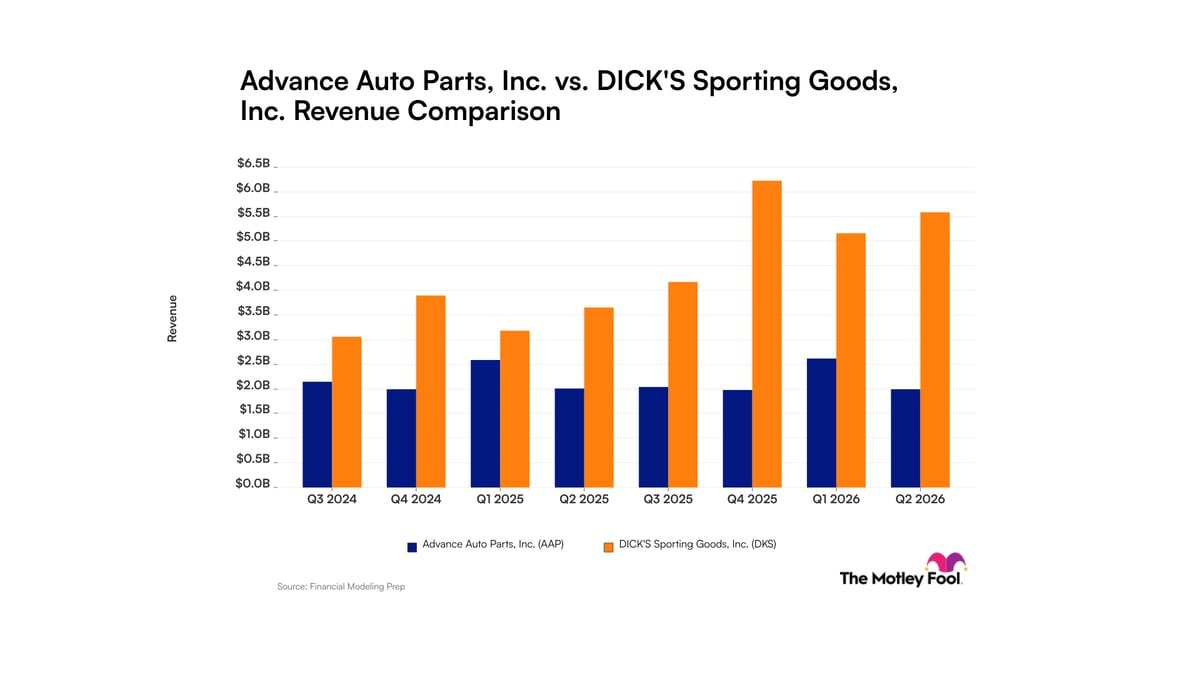
Advance Auto Parts vs. Dick’s Sporting Goods Revenue over the last 8 quarters. Note: for Q1 2025, Q1 2026, the two companies’ reporting periods differ in length by more than 14 days due to differing fiscal calendars, which can make the change between quarters look bigger or smaller than an apples-to-apples comparison would show.
Quarterly Revenue for Advance Auto Parts and Dick’s Sporting Goods
| Calendar quarter | Advance Auto Parts Revenue | Dick’s Sporting Goods Revenue |
|---|---|---|
| Q3 2024 | $2.1 billion (quarter ended Oct. 5, 2024) | $3.1 billion (quarter ended Nov. 2, 2024) |
| Q4 2024 | $2.0 billion (quarter ended Dec. 28, 2024) | $3.9 billion (quarter ended Feb. 1, 2025) |
| Q1 2025 | $2.6 billion (quarter ended April 19, 2025) | $3.2 billion (quarter ended May 3, 2025) |
| Q2 2025 | $2.0 billion (quarter ended July 12, 2025) | $3.6 billion (quarter ended Aug. 2, 2025) |
| Q3 2025 | $2.0 billion (quarter ended Oct. 4, 2025) | $4.2 billion (quarter ended Nov. 1, 2025) |
| Q4 2025 | $2.0 billion (quarter ended Jan. 3, 2026) | $6.2 billion (quarter ended Jan. 31, 2026) |
| Q1 2026 | $2.6 billion (quarter ended April 25, 2026) | $5.2 billion (quarter ended May 2, 2026) |
| Q2 2026 | $2.0 billion (quarter ended July 18, 2026) | $5.6 billion (quarter ended Aug. 1, 2026) |
Foolish Take
Normally, the first thing to note when examining a company’s revenue trend is seasonality: some times of the year have stronger buying patterns than others. For most stocks, compare revenue year over year, by quarter. In normal times, seasonality holds true for consumer goods stocks like these as well. The seasonality for various products does mitigate that to some extent for both stocks: air conditioning products are more in demand in the summer, while car batteries get more interest in winter, for Advance Auto Parts, for instance. For sporting goods, summer sports and camping draw ion shoppers in the spring and summer, while winter sports goods draw greater foot traffic in the colder months.
So reading the revenue trend left to right on the chart isn’t quite the way to interpret it–that shows more volatility in sales for both stocks than Wall Street reads. Comparing quarter to like prior-year quarter, we see that Dick’s is showing strong growth, while Advance Auto Parts is showing trouble pushing revenue higher in recent quarters.
Revenue is perhaps the simplest metric investors have to judge a business by. As the chart shows, look for rising revenue, especially over similar periods of each year, and take comparable-quarter stagnation, or worse, declines, as a red flag.
Data source: Financial Modeling Prep. Note: For Q1 2025 and Q1 2026, the two companies’ reporting periods differ by more than 14 days due to differing fiscal calendars, which can make the change between quarters appear larger or smaller than an apples-to-apples comparison would show. Data as of Nov. 1, 2026.






Leave a Reply