
Since Claude’s initial release by Anthropic in 2023, Claude became famous among LLMs for having the ability to reason through complex problems, analyze large amounts of context, and generate highly structured outputs. This made it a strong choice among developers who use the model for coding or troubleshooting workflows, especially in the last year or so, with the release of Claude Code in February of 2025.
What is often overlooked is Claude’s ability to help designers speed up and automate their workflows, too, mostly with branded data visualizations and the automation of repetitive design tasks.
As a general note, when used effectively, AI can help designers unlock velocity on repetitive, time-consuming design tasks to save their creative stamina for higher lift assets. In this article, I’ll be going over the ways designers can leverage Claude specifically.
Using Claude to Automate Branded Data Visualizations
To begin, data visualization (sometimes abbreviated as “data viz”) is any graph, chart or visual representation of data to help readers easily understand trends and patterns within a data set that has been curated. When creating data viz, it’s important to leverage your unique branding and style to highlight and convey the purpose of your data.
Once you understand your visual direction for your data viz or you have references that you’ve curated, you can leverage Claude to generate branded graphs and charts. Do keep in mind that for these types of tasks, Claude needs to be given specific brand guidelines and directions on how to execute said data visualizations.
Training Claude on your data visualization references such as bar charts, line charts, pie charts and other data viz assets can speed up workflows immensely both on the design team and the marketing team when it comes to creating assets like pitch decks and blog imagery.
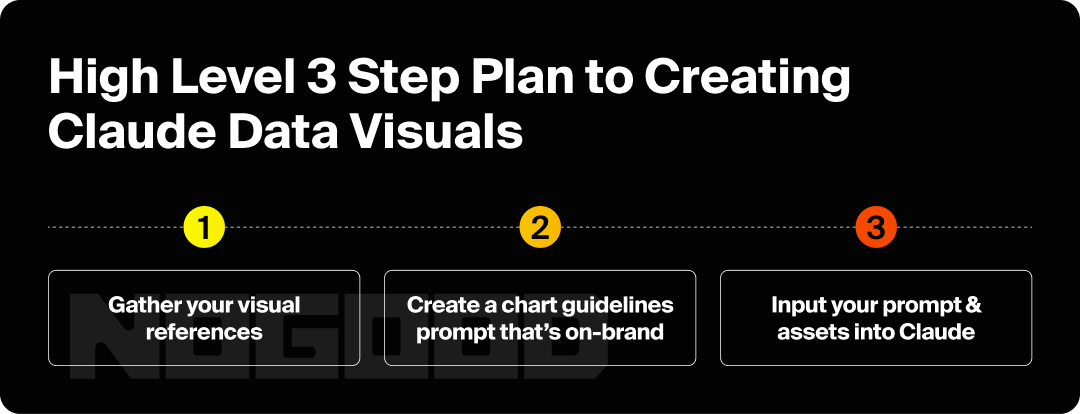
Based on my own experience leveraging Claude, I’d recommend using a three part process:
- Gather your visual references + brand guidelines + design files you’ll need to upload
- Create a prompt that includes your brand guidelines + any design specifications
- Input your prompt, visual assets, design files into a Claude Project and start generating
1. Gathering References, Brand Guidelines & Design Files & Setting Up Your Project
For visual references, branded data visuals that you’ve already created are best to use here. You want to make sure that these references are following the design specifications that you’ll be writing into your prompt. An example of a design specification can be adding vertical and horizontal margin instructions so that no information flows off of your canvas.
As for specific design files, you will need to have your font files, logo files, and watermark files ready. Any file that you anticipate Claude will need to use within the visual should be gathered together into a file that you can easily upload.
Once you have your files in place, create a Claude Project within your account and upload your font, logo, watermark files within your project files so that Claude can reference your files easily. You may also want to include project instructions to help Claude understand what file is for what purpose and to help instruct Claude on how/when to use each asset.
This file upload area is also where you’ll be uploading your final prompt when you’re finished creating your master prompt. With these files uploaded to the project, any chat that you create within the project will source information and assets from these files, making it easy to work on multiple projects at once with your files.

2. Adding Brand Guidelines & Formatting Your Prompt
Before constructing a “final output” prompt, you want to make sure that you have given Claude clear brand guidelines that the LLM will be able to follow. You can download and upload your brand guidelines into the chatbot, or you can turn your official brand document into an “AI-ready” set of brand guidelines that is concise and easy for them to follow.
Pro Tip: Claude can help you turn a brand deck into LLM-friendly brand guidelines!
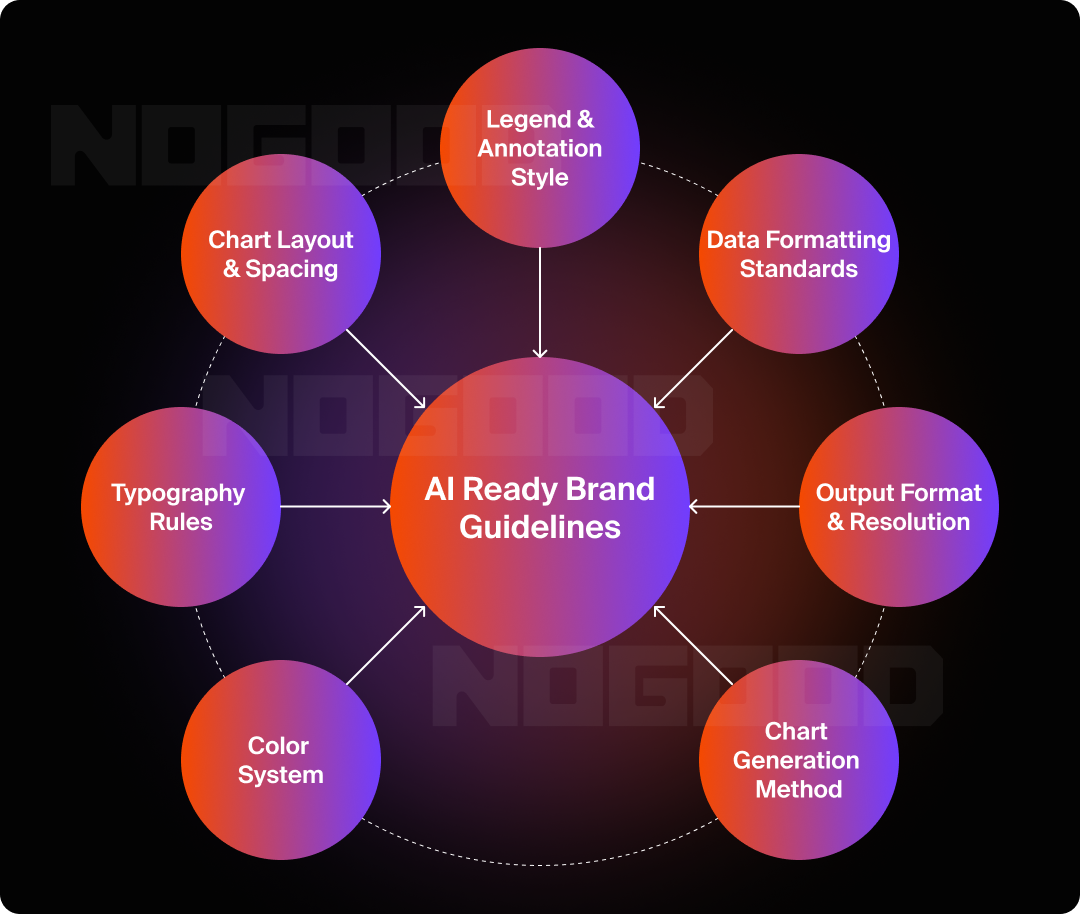
Here’s everything that I would include in my AI-ready brand guidelines:
- Color System + Hierarchy: What are my primary, secondary, and accent colors? Do I have exact hex codes, or am I approximating? Which color represents the most important data point, and which colors recede into the background?
- Background & Surface Colors: Am I working in dark mode or light mode? What is my canvas background color? How does my text and gridline color contrast against it?
- Typography + Hierarchy: What font am I using for headlines, body text, and data labels? Do I have the actual font files, or just the font name? Is there a size and weight hierarchy that I want Claude to follow consistently across every chart?
- Chart Anatomy & Spacing: What are my canvas dimensions? How much padding and margin do I want around the chart area? How heavy or light should my gridlines and axis lines be? What do I want to show and what do I want to hide?
- Legend & Annotation Style: Where should the legend live: inside the chart, below it, and do I even need one? Do I prefer inline labels directly on the data or a separate key? How should callouts and annotations be styled when I need to highlight a specific data point?
- Data Formatting Standards: How many decimal places do I want to display? Do I want a thousands separator? At what point do I shorten numbers; the thousands, the millions? Are there any units or symbols (%, $, x) that should always appear with my values?
- Output Format & Resolution: What file format do I need (PNG, SVG, PDF, etc.)? What are my pixel dimensions? What DPI do I need for the intended use: web, presentation, or print?
- Chart Generation Method: Am I using Matplotlib or PIL?Have I confirmed that my chosen method can support the chart type and styling complexity I need?
Don’t worry if your prompt isn’t perfect at first. This prompt you’ll constantly be reiterating as well as having Claude assist you in reformatting.
3. Creating Your First Automated Brand Data Chart
Once you have your prompt, as well as any relevant design files and references, you’ll want to create a Claude Project or Claude Chat and upload all of your files.
I’d recommend using a Claude Chat first, and then migrating your assets to a Claude Project once you’re confident that your prompt is consistent and will work effectively. The reason for this is that in the early stages of this process, you’ll likely be troubleshooting the prompt and making updates constantly. In short: finalize the prompt and validate that it works, then move it over to a more “permanent” location.
A prompt that you might have initially uploaded into a Project may become outdated by the time you troubleshoot all the initial errors. If you start a new Chat or Project, make sure that you’re using the most up to date version of your prompt.
Troubleshooting & Prompt Iteration in Claude
Charts might not always look perfect on your first try, so it’s important to understand how to troubleshoot effectively and efficiently. Your troubleshooting workflow should look something like this:

Claude as Powerful Resource to Automate Data Visualization
When used efficiently, Claude empowers those in non-design departments (such as marketing and operations) who may not possess the technical design skills to create branded data visualizations that can be easily created to insert in pitch decks and more.
Now, please understand this: Claude doesn’t eliminate the craft, it eliminates the friction and barriers to entry. From what I’ve seen, Claude excels at simple branded data visualizations when you have strong references for Claude to use.
For more creative designs for data visualization, I’d recommend to still rely on your designers’ skills to help deliver the best possible product.
What we’ve covered here is only one of the many tasks Claude is capable of. As Claude continues to evolve, the range of design and marketing tasks it can assist with will only grow. The teams that build strong AI workflows now are the ones that will move fastest when the next capability drops.