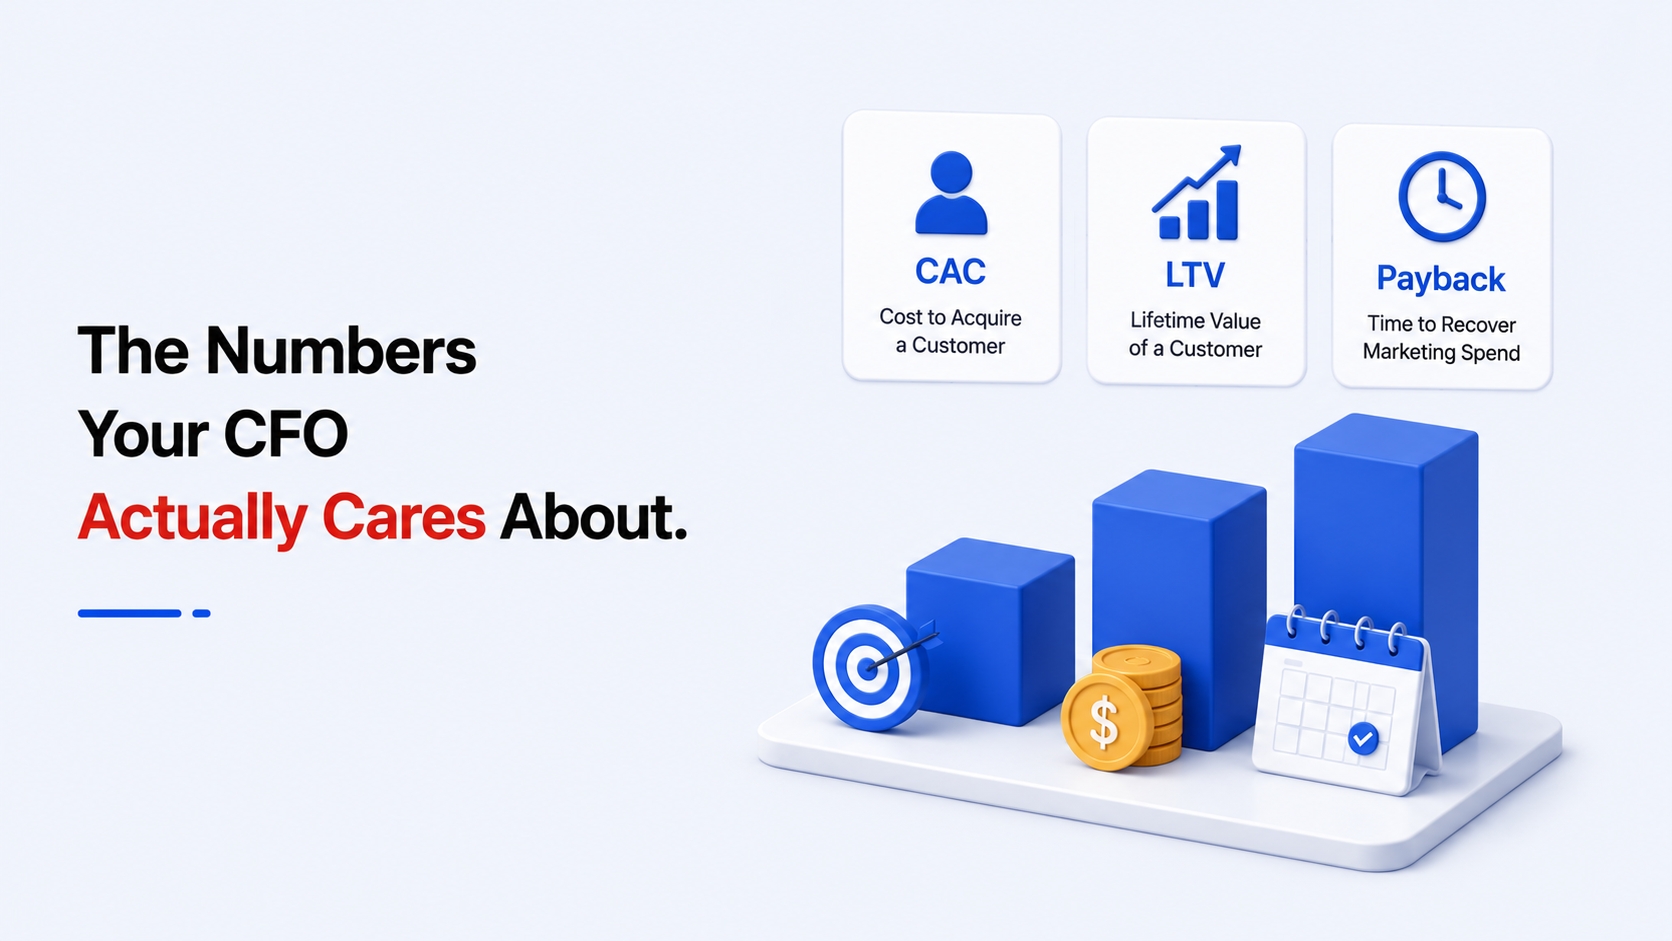
Many marketers wonder how to have productive conversations with finance around marketing budgets. Understanding the fundamentals of customer acquisition cost formula, lifetime value (LTV), LTV to CAC ratio and CAC payback period is vital to bridge the language divide between marketing and finance departments. These marketing unit economics allow you to defend budgets, justify spend and show financial impact well beyond traditional dashboard reports. This guide provides a clear explanation of what these terms mean, how to calculate CAC, what costs belong inside CAC, how to estimate LTV and what a healthy LTV to CAC ratio looks like, especially for teams without years of historical data.
Understanding Customer Acquisition Cost
Start by taking a close look at customer acquisition cost. At its core, CAC answers how much your business spends to get each new customer. This number provides clarity for budget analysis and forms the foundation for many other marketing strategies. Knowing your CAC allows you to evaluate if your marketing spend aligns with your company’s growth targets and profit margins.
Breaking Down the Customer Acquisition Cost Formula
The customer acquisition cost formula is straightforward. Add up your total sales and marketing costs over a given period, then divide by the number of new customers acquired in that same period. The formula looks like this:
- CAC = Total Sales and Marketing Spend / Number of New Customers
Understanding how to calculate CAC accurately requires choosing the right period and ensuring all relevant costs are included.
What Counts as a Marketing Cost Inside CAC?
It’s important to get your inputs right. Comprehensive CAC calculations should include salaries for sales and marketing teams, marketing automation subscriptions, paid advertising, creative asset costs, agency fees, and technology expenditures like your AI marketing operations platform. Sometimes businesses miss out on software fees or internal overhead involved in marketing strategies. Be consistent about which costs you include, and revisit your assumptions as your team or approach changes.
Blended vs Paid CAC
A nuanced look at CAC considers both blended and paid acquisition costs. Blended CAC factors total costs from both organic and paid channels, offering a full picture of marketing efficiency. Paid CAC, on the other hand, only considers costs for paid marketing channels like digital ads, influencer partnerships, or paid events. By comparing blended vs paid CAC, managers can understand how earned media and direct spend contribute to overall growth. This distinction improves reporting for finance and more accurate budget analysis.
Marketing Unit Economics Beyond Averages
Finance leaders don’t settle for dashboard averages. They demand insight into the building blocks of your business model. Marketing unit economics gives you the tools to understand, predict and communicate the cost and potential value of each new customer. The numbers matter even more when every dollar is scrutinised.
Why Marketing Efficiency Metrics Matter
Marketing efficiency metrics go deeper than reach and engagement. CAC, LTV, the LTV to CAC ratio, and CAC payback period let your team prove channel-by-channel performance and long-term value of marketing investments. They drive more efficient planning inside a modern AI marketing strategy and can guide smarter use of marketing automation tools.
Linking Budget Analysis to Growth
Before launching new campaigns or expanding into fresh channels, a clear grasp of unit economics ensures your budget works harder. A well-grounded budget analysis, anchored in customer acquisition cost and projected LTV, allows you to set realistic targets and avoid overspending. This disciplined approach reassures your finance team that marketing spend is driving profitable, sustainable growth.
Decoding Lifetime Value (LTV)
Once CAC is under control, turn attention towards calculating your Customer Lifetime Value. LTV estimates how much revenue the average customer generates during their entire relationship with your business. For B2B companies, this requires analysing expected contract lengths, average purchase values and retention rates.
Lifetime Value Calculation in B2B Contexts
The classic LTV formula for B2B organisations is:
- LTV = Average Revenue per Customer × Average Customer Lifespan
If you operate on yearly contracts or subscriptions, factor in renewal rates to estimate “average customer lifespan.” When historical data is thin, look at industry benchmarks or model scenarios conservatively for financial planning. Start simple, then refine your estimates as more data accumulates.
Estimating Lifetime Value Without Years of Data
Wondering how to estimate LTV when your product or service is new? Begin with early customer data, using average deal size and best-guess retention estimates. If your churn rate is unclear, apply a conservative assumption—such as one to two years of customer lifespan—until you have more insight. Document assumptions transparently for your CFO and revisit them as data grows.
Applying the LTV to CAC Ratio
Eye-catching dashboards rarely convince finance leaders. Instead, bring the conversation back to the LTV to CAC ratio. This metric tells you how much revenue each new customer brings for every pound spent acquiring them. Healthy LTV to CAC ratios ensure marketing remains a growth engine, not a cost centre.
What Is a Healthy LTV to CAC Ratio?
As a general guide, a healthy LTV to CAC ratio is 3:1 or higher. This means for every £1 spent on acquisition, you expect at least £3 back in customer lifetime value. Some high-growth models accept lower ratios temporarily for aggressive expansion, but sustained businesses should aim well above break-even. Ratios higher than 5:1 may suggest underinvestment in marketing or missed opportunities.
How the LTV to CAC Ratio Informs Marketing Strategies
Regularly tracking your LTV to CAC ratio leads to smarter marketing strategies. If your ratio drops, focus on improving retention, boosting average spend, or reducing CAC. Strong ratios empower you to invest more confidently in new channels, marketing automation or campaigns. Use these insights to adjust your approach in line with evolving company goals.
Understanding CAC Payback Period
While LTV to CAC ratio gives the big picture, CAC payback period addresses a key cash flow concern for finance. CAC payback period measures how many months it takes to recover your acquisition investment from a typical new customer’s net contribution margin.
Why CAC Payback Matters More Than ROI
Unlike ROI, which tracks long-term return, CAC payback focuses on how quickly you recoup marketing outlays. This matters when budgeting for rapid expansion or when cash flow management is tight. Quicker CAC payback periods reduce risk, build trust with finance, and allow you to scale faster if the business can reinvest earnings rapidly.
Calculating the CAC Payback Period
To calculate CAC payback, use:
- CAC Payback Period = CAC / Average Monthly Gross Margin per Customer
A typical target is a payback under 12 months, though acceptable periods vary by sector. Discuss openly with your CFO to identify the preferred trade-off between growth speed and financial safety.
The Role of Marketing Automation Suite and AI Tools
Advanced AI marketing strategy platforms and marketing automation suites simplify measurement, implementation and reporting across CAC, LTV and related metrics. By automating campaign management, performance analysis and forecasting, your team spends more time on optimisation and less on manual data gathering. Integrated platforms ensure that core performance metrics connect directly to planning and execution, giving an accurate view of marketing efficiency and unit economics in real time.
Automated Budget Analysis for Smarter Decisions
Budget analysis through a marketing automation suite strengthens your position with finance. With reliable, continuous tracking of both blended vs paid CAC and forecasting of LTV payback, everyone sees exactly how budget allocation translates to business outcomes. This level of visibility improves interdepartmental trust and guides the shape of future marketing strategies.
Aligning Numbers with Marketing Strategy
A robust AI marketing operations platform integrates data from every channel into your marketing strategy, ensuring you act quickly when results shift. Having unit economics embedded into every campaign brief, channel report and programme review enables true financial accountability. Data-informed marketing strategies reflect not just what works, but what pays.
Changing Budget Allocation with Unit Economics
As you monitor CAC, LTV to CAC ratio and CAC payback period, reassess budget allocation regularly. If paid CAC spikes due to higher AD competition, shift focus to organic or referral campaigns. If LTV increases after new retention features, invest more aggressively in acquisition. This adaptive approach ensures your marketing strategy translates data into smart spend.
Presenting the Numbers to Finance
When finance asks for proof that marketing is working, lead with CAC, LTV, LTV to CAC ratio and CAC payback period. Explain how each number is calculated, what costs are included and why they matter for growth. Prepare forecasts based on different marketing automation scenarios and highlight changes driven by past campaigns. Use concrete numbers and clear graphics, and connect every target to wider business goals for maximum credibility.
Practical Tips for Maximising Growth
Mastering marketing unit economics is not about chasing the lowest CAC or highest LTV in isolation. Best-in-class teams set targets for each component, track them continuously, and adapt marketing strategies based on what really drives profitable growth. Collaboration between marketing, finance and operations ensures every campaign is both creative and financially sustainable.
Mistakes to Avoid in Measurement
Avoid underestimating hidden costs in your CAC calculation and beware of using superficial LTV forecasting methods. Shift away from vanity metrics and use verified marketing efficiency metrics as the backbone for budget analysis. Revisit and refine your marketing strategy quarterly so financial assumptions always keep pace with evolving business realities.
!function(f,b,e,v,n,t,s)
{if(f.fbq)return;n=f.fbq=function(){n.callMethod?
n.callMethod.apply(n,arguments):n.queue.push(arguments)};
if(!f._fbq)f._fbq=n;n.push=n;n.loaded=!0;n.version=’2.0′;
n.queue=[];t=b.createElement(e);t.async=!0;
t.src=v;s=b.getElementsByTagName(e)[0];
s.parentNode.insertBefore(t,s)}(window, document,’script’,
‘https://connect.facebook.net/en_US/fbevents.js’);
fbq(‘init’, ‘1122401991165798’);
fbq(‘track’, ‘PageView’);